
Map Channel Sample Areas
About Channel Sample Areas
Note: The Areas
tab will only appear in the Mapping
Task Bar if your system
configuration file contains a correctly defined <Areas>...</Areas>
section.
Channel samples can be associated with an outline area on a face map. This can be used in area-weighted assay value calculations in downstream resource estimation.
It is expected that areas are defined after channel samples have been specified, although this isn't enforced.
Areas are defined within the current map profile(s), completely filling them. Area information is added to the channel samples and can be exported to other packages for more detailed resource assessment, e.g. Studio RM, where area weighting can be considered.
- Sample areas can be defined before or after map georeferencing.
- Sample area formatting can be controlled using a 3D display template associated with the <AREAS> element of your configuration file.
Typically, you will create a set of sample areas (enclosed regions) that fill the profile or profiles assigned to the map face, and each area will encompass one sample centre point (although multiple sample points are also supported, whereby channel sample length weighting is used to derive part of the associated area).
Tip: If you are using a portable device, automatically display a screen keyboard for easier data entry at the face. Enable screen keyboard mode using the Setup ribbon's On-Screen Keyboard command.
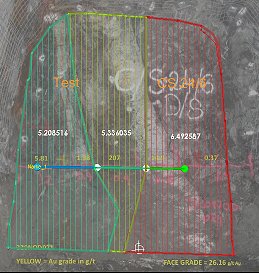
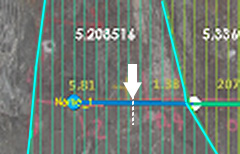
For example, in the image below, the sample centre position for the initial sample in the channel falls within the cyan area. The area (5.08514) is attributed to this sample.
Note: Channel sample area
information is added to the channel sample data when the
project is saved.
Once an area has been defined, each sample centre position on the channel (or channels) will be attributed with an area value. This will either be the entire area calculation of the polygon in which a single sample is located, or a portion of that overall area if multiple sample centres fall within the same area, with longer samples being attributed a large area value than shorter ones.
Tip: Whilst digitizing, you can complete the digitizing operation by double-clicking or double-tapping the final string vertex position.
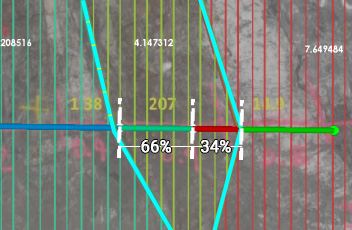
For example, in the image below, two sample centres fall within the cyan area. The area value (4.147312) will be divided proportionally between the two samples, based on their lengths (In this case, approximately 1/3 and 2/3 of the area apiece):
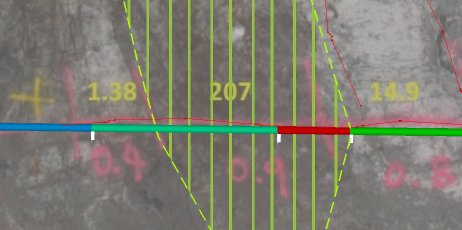
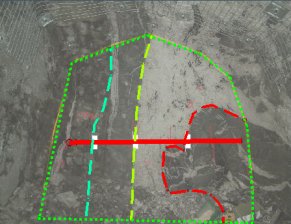
The full length of the sample is used to determine length weighting. For example, in the following image, the green channel sample is 3 times longer than the red, so will be assigned 3/4 of the area, (and the red sample the remaining quarter) even if some of the green channel falls outside the area:
Tip: When digitising polygonal areas, it can be useful to enable smart snapping mode to ensure neighbouring areas have no unexpected gaps between them.
Note: You can digitize face map data type using either the 3D map or butterfly map view. Butterfly maps are only available if your configuration permits it.
The Areas Table
Area information is displayed and updated dynamically within the Mapping task bar. For each area defined, you will see a corresponding area name, the area value (for polygons and outlines) and an overlap percentage, which will be zero if the area doesn't overlap another. You can also see the number of sample centres that fall within that area.
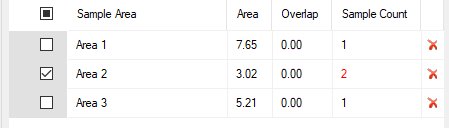
The Map Areas Table
containing 3 polygon areas (the central area encompasses two sample
centres)
The initial check box can be used to switch the view of sample areas on or off (no data is actually modified, only its visibility).
The contents of this table are updated automatically as your data changes. For example, after modifying the shape of an area polygon or string, or adding or deleting an area.
Area data is saved within your database when you save your project (or it is saved automatically).
Digitizing Area Data
Area data is represented on a map as one of the following string types:
-
Open string
A digitized string that can be used to define an outline channel sample area on a map.
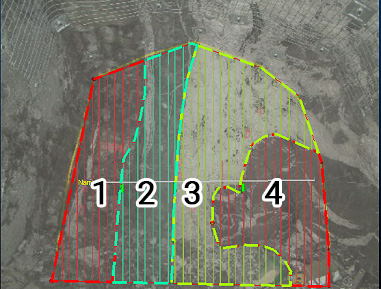
For example, the map below has 3 string items within the map profile (shown with the long dashed lines - the green dotted outline is the profile). The area strings are used to define four enclosed areas using the Create Outline function (see below), each containing one sample:
Whilst area strings won't contribute to the recorded Sample Area (see below) and have no Area or Overlap value, they are used to dissect a profile for the purpose of generating an outline later. This approach can make it easier to ensure gaps don't occur between areas and areas are enclosed within a profile. -
Closed polygon
A manually digitized closed string. These areas can be digitized anywhere on a face.
A closed polygon area will contribute to the overall Sample Area check value (see below). If a polygon area overlaps another, the sum area of overlapping data for that area will be shown in the Overlap column of the Areas table (see above). Generally, each area will contain a single channel sample centre, although multiple samples are also supported using length weighting.
Overlapping data will increase the %Error figure.
-
Outline
An enclosed string, automatically generated between other map area data. To create an outline, you select Add Outline , then click within the map profile - a closed outline area is created automatically. Following the example above, four outlines can be generated:
As a closed string, an outline will contribute to the Sample Area for the map and can potentially overlap other outline areas.
All
area data (string, polygon, outline) can be edited using the options
on the Draw
(Areas) ribbon. This ribbon
is also used to access snapping and other drawing modes.
Checks and Warnings
It is assumed that areas will be defined;
- to fill the internal area of the map profile, or all profiles if multiple profiles have been assigned to the face. A tolerance value is set in the configuration file to determine how accurately each profile must be filled.
- so that areas don't overlap, or they overlap within a predefined % tolerance of each area value.
- so that each sample within an area is assigned an area value
- so that each area contains at least one sample
To check the validity of defined areas, the Areas panel will display the following global check values, and are updated dynamically as map areas are defined or adjusted:
- Profile Area: the area within the profile or profiles that are assigned to the map
- Sample Area: the sum total of all defined outlines and polygons on the face map
The difference between these values is displayed as the %Error
figure. This value will either be within the tolerance specified in
your external configuration
file or above it, in which case a warning will be issued.
For example, in a system where a 0.5% tolerance is set (i.e. the maximum difference between the profile(s) area and the sum of all areas must be less than 0.5%), you will either see "NO WARNINGS", or "WARNINGS". If the latter, you can click the button to see more information in the Output control bar.
For example, if the current system configuration is to permit up to a 5% discrepancy between profile and sample areas, you would see the following:
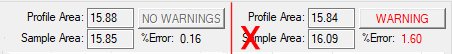
In the error situation, clicking WARNING displays a message similar to the following in the Output window:
Areas have an error of 1.60%, which exceeds the configured error of 0.50%
As the Sample Area (16.09)
is higher than the Profile Area
(15.84) in this case, the cause is most likely to be overlapping areas.
This can be reviewed by checking the Areas
table, e.g.:
A warning will
also be issued if:
- the active map face does not contain any channel sample data
- samples exist on the map face that are not contained within any area
- a profile has not yet been added to the current map face
- the Profile Area vs. Sample Area differs by greater than the predefined % allowance for your system*
- one or more areas exist on the map that do not contain a sample
- areas overlap by more than the predefined % allowance*
* Tolerance values are defined in the <Areas>...</Areas>
section of your XML configuration file.
Activities
To add an area polygon to a face
- Select the appropriate Map and Face using the drop-down lists provided.
- Select the Areas tab of the Mapping task bar.
- If your map doesn't have a profile, create one.
- Whereas digitizing is supported in the 3D World view (for georeferenced maps), you may find it easier to swap to a local Map window using the View Map function, if a map view is not already displayed.
- Configure any snapping or drawing modes you wish to use. These can be found on the Draw (Areas) ribbon.
- Click New Polygon.
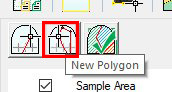
(This button is also available on the Home ribbon) -
Digitize an area within the profile(s) of the face that represents the zone to which one or more channel samples relate. This will commonly be a lithological boundary. The digitized area will be added to the sum of existing sample areas on the active face. Any overlaps with neighbouring areas will be reported in the Areas table, with excessive overlaps highlighted in red.
The direction of digitizing is not important (clockwise or anticlockwise) but ensure you don't have internal overlaps/crossovers.
- Click Done to complete digitizing
- Repeat the above steps for all areas required.
- Save your project.
To add a string to a face:
- Select the appropriate Map and Face using the drop-down lists provided.
- Select the Areas tab of the Mapping task bar.
- If your map doesn't have a profile, create one.
- Whereas digitizing is supported in the 3D World view (for georeferenced maps), you may find it easier to swap to a local Map window using the View Map function, if a map view is not already displayed.
- Configure any snapping or drawing modes you wish to use. These can be found on the Draw (Areas) ribbon.
- Click New String.
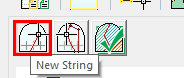
(This button is also available on the Home ribbon) - Digitize an open line that will be used to partly describe a boundary for a generated outline later (see below). Outlines can be created from any number of open or closed string edges.
- Click Done to complete digitizing
- Repeat the above steps for all strings required.
- Save your project.
To generate an outline area:
- Select the appropriate Map and Face using the drop-down lists provided.
- Select the Areas tab of the Mapping task bar.
- If your map doesn't have a profile, create one.
- Complete the digitizing of all area strings and/or polygons that will form part or all of the boundary of your outline.
- Click New Outline.
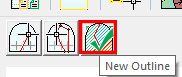
(This button is also available on the Home ribbon) - Click in the map view to generate an outline around all bounding area data items (strings or polygons).
- Select other points around which to generate outlines.
- Save your project.
Export Sample Area Data
Sample area data is added to your channel sample data when the project is saved. Mapping data, including channel sample information can be exported to other systems using the information found in Exporting Map Data.
Related topics and activities